The latest round of quarterly real estate statistics for Boulder County are not as robust as we have grown accustomed to seeing. The superlatives describing growth upon growth have paused for a quarter or two. I liken it to an inevitable hangover after the...
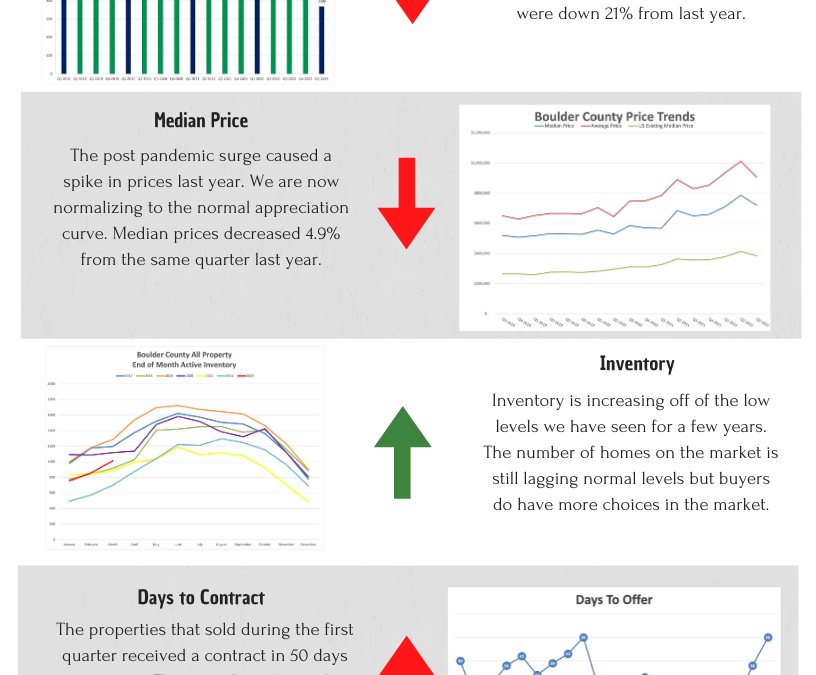
Spring is here! More new listings are coming on the market and the buyers have options. Inventory in Boulder County rose by 18% during the month to just over 1,000 listings. At the end of March, 42% of active listings were already under contract which is back to 2019...
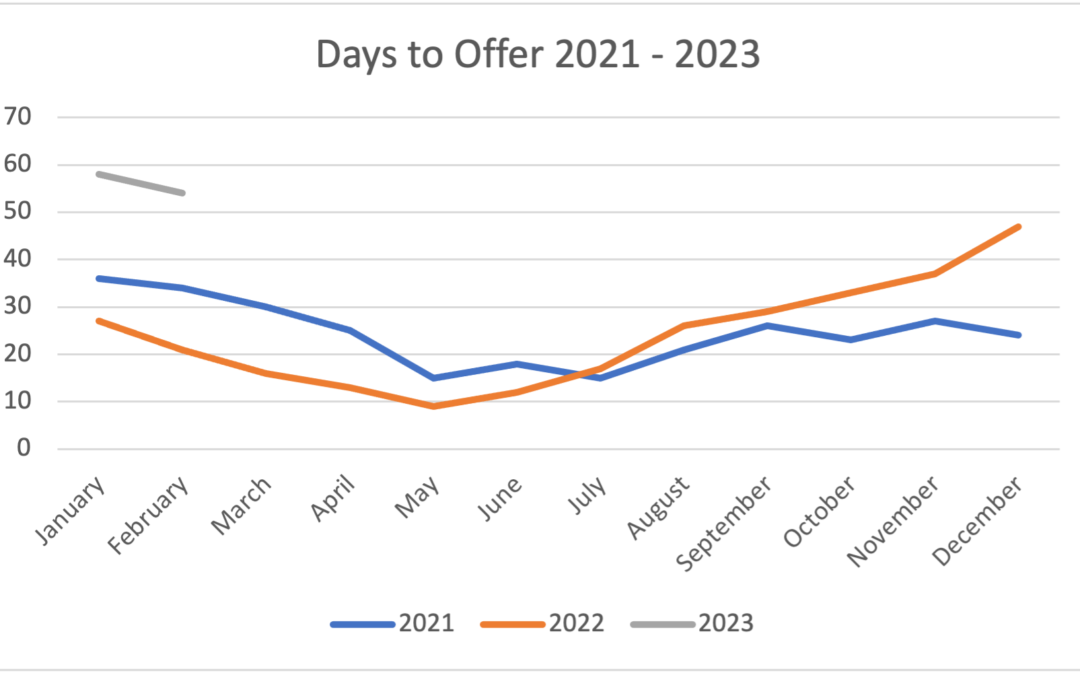
When I’m asked about the market I note that it is more balanced than one might expect. Although it is taking longer, houses are still selling and prices are holding up remarkably well. At the end of February 2021, 75% of active listings were under contract. This...
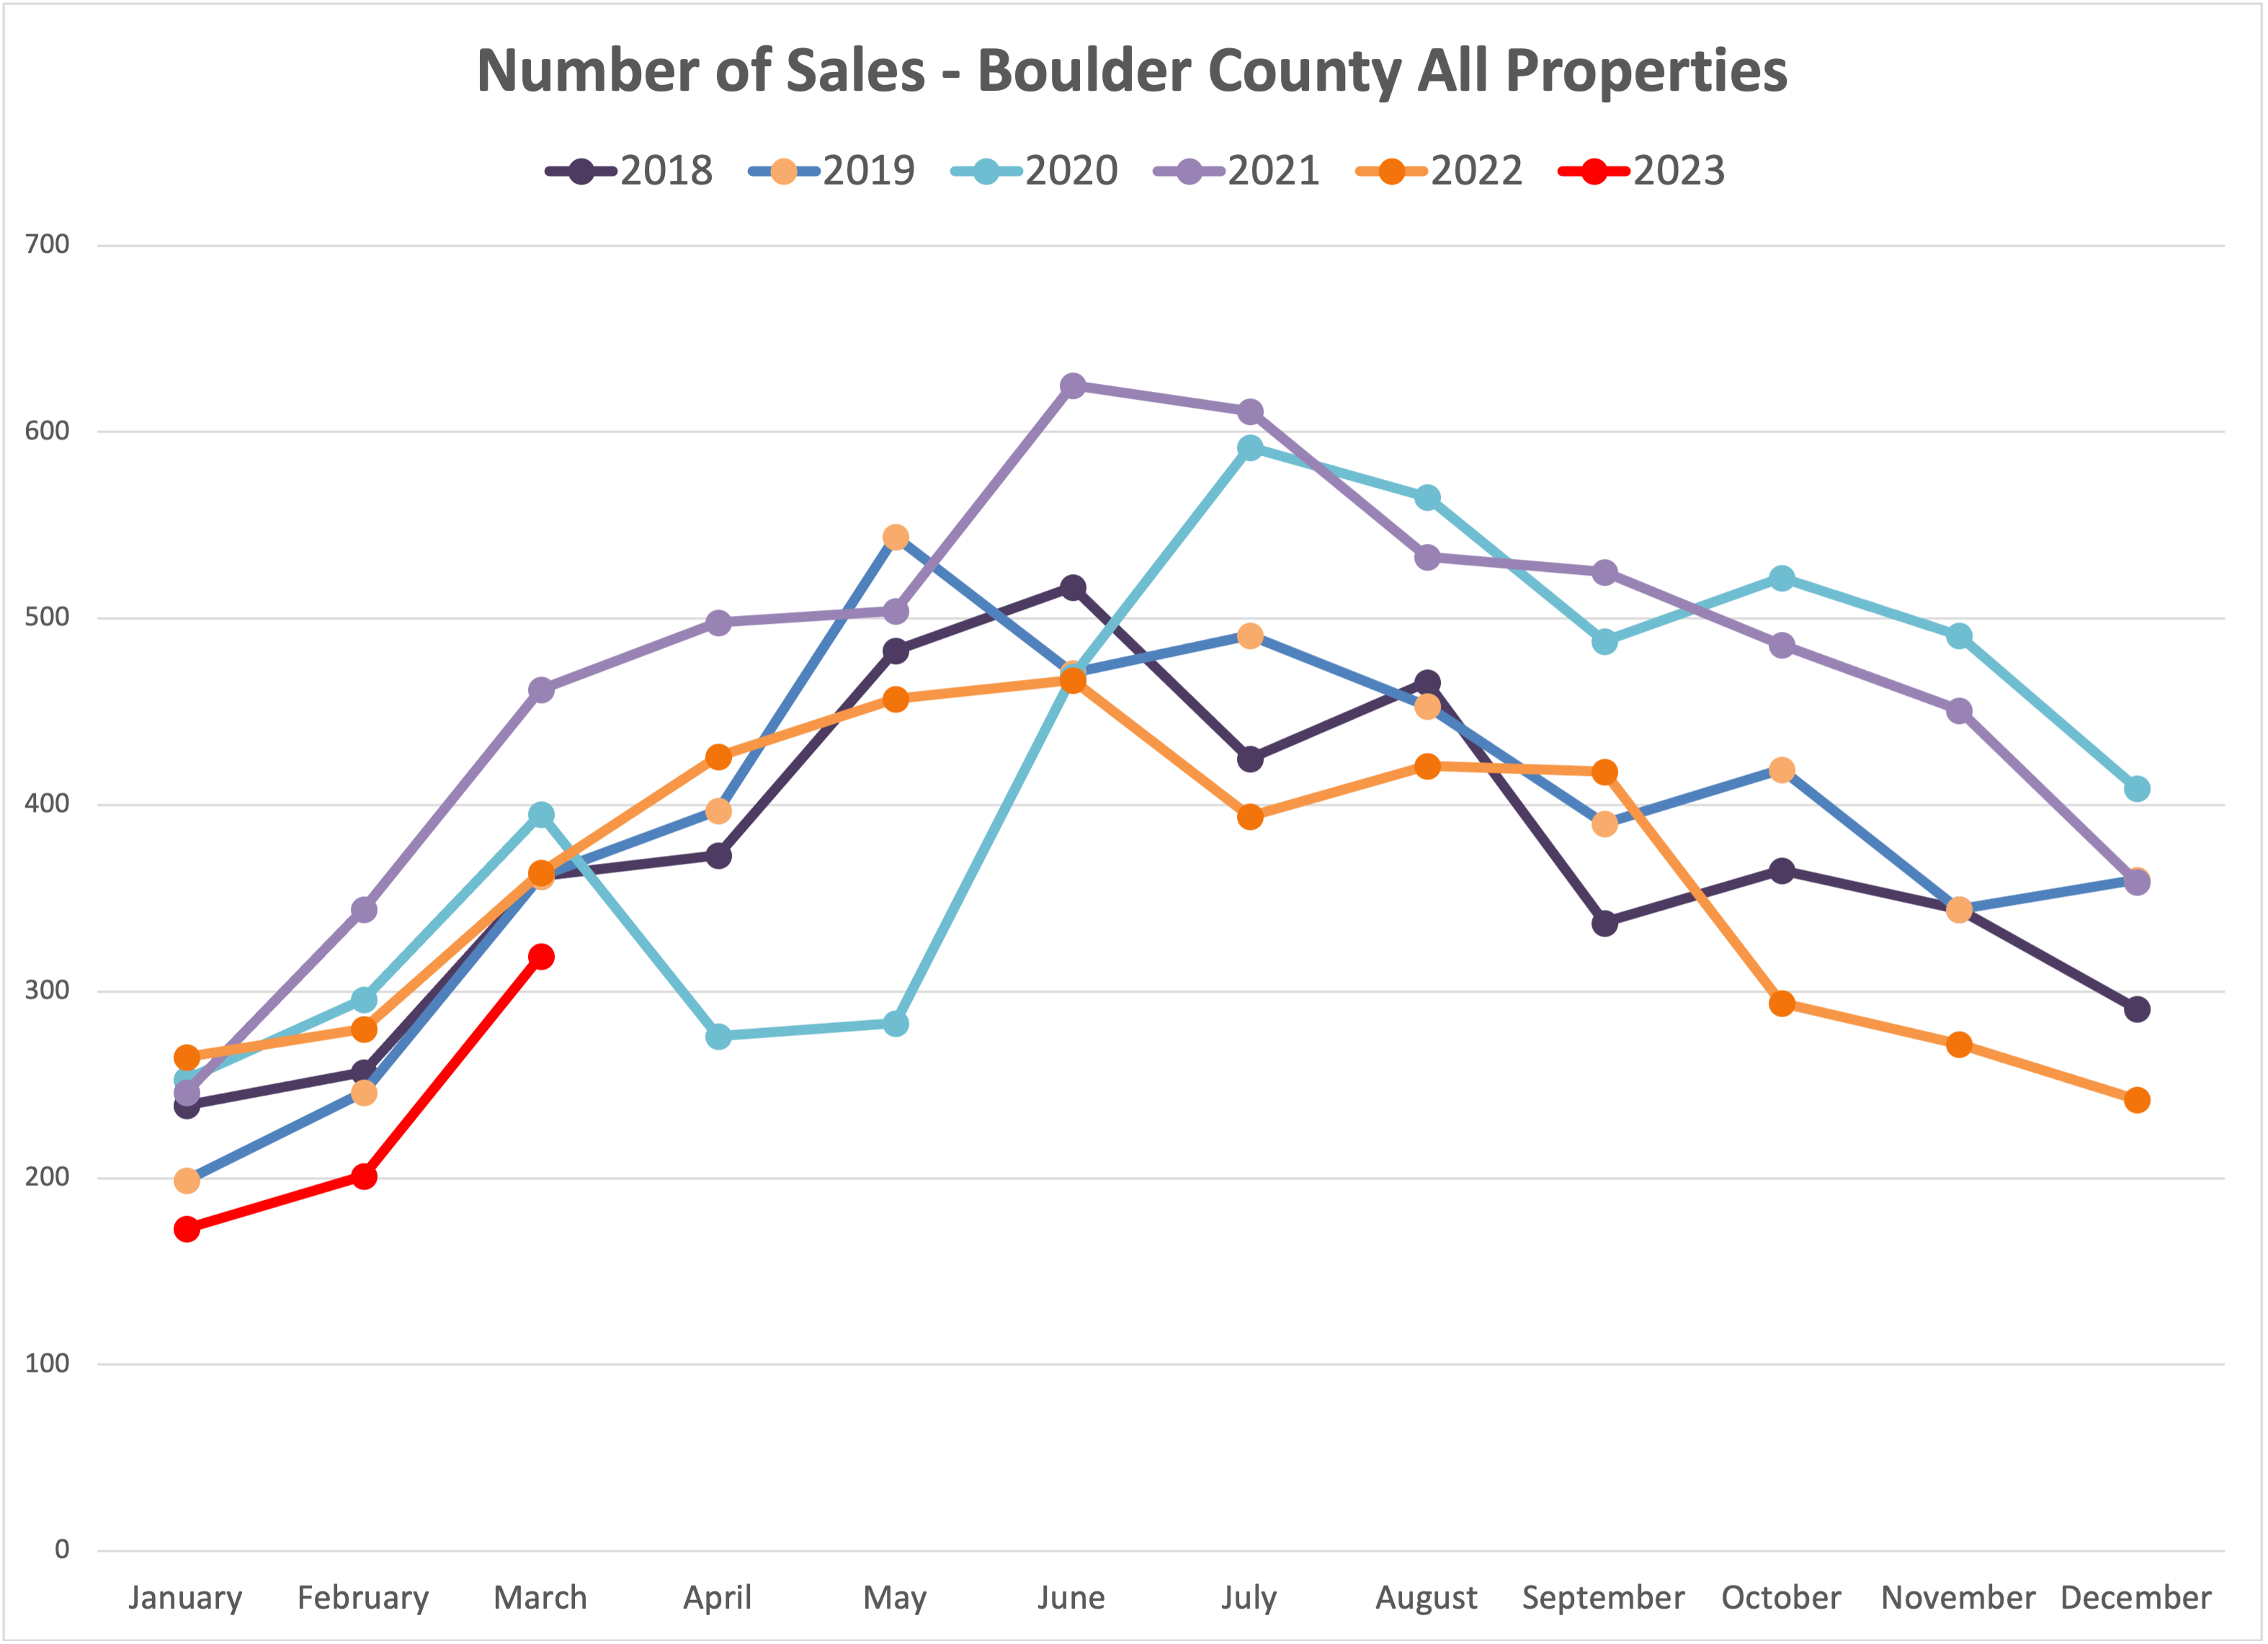
January is normally a slow month for closings. This year was no exception. However, the sales this past month were at the lowest level since 2009. The flow of properties going under contract is still very low, but there are still sales happening every day. Inventory...
2022 Boulder County Real Estate Market Report Overview As I look back on 2022, I can still recall that sinking feeling in my stomach I had last spring as I was trying to help my clients create a winning bid. How much should they offer? How do we waive the appraisal?...